Diagrams
By pressing the Projection-Tab you will get a plot with the stored data of the table. You can choose between three different types of diagrams with the segmented button in the upper bar. By tapping the action button you can print the currently displayed graphics (using AirPrint) or send it as an attached pdf document by email. The quality of the output is in the current version relatively poor. I will see if I can find a way to enhance the image quality in a next program update.
Tapping the Info Button in the upper right of the screen flips the view and shows a picker from which you can select a collection. When you return to the diagram view, only the data in the selected collection are plotted in the diagram.
Rose Diagram
In this simple Rose Diagram, the distribution of the dip directions for all measurements is displayed. The compass circle is divided into 36 classes, each with an angular width of 10°. The radii of the segments are proportional to the amount of measurements whose dip directions are in the range of these classes. The segment that represent the class with the most data is always scaled to 100% (= the full circle radius).
Joint Diagram
In the Joint Diagram, the distribution of the strike directions for all measurements is displayed. The compass circle is divided into 36 classes, each with an angular width of 10°. The radii of the segments are proportional to the amount of measurements whose dip directions are in the range of these classes. The segment that represent the class with the most data is always scaled to 100% (= the full circle radius). Because the strike is measured between 0 and 180°, all values are mirrored to the region between 180 and 360°. This results in a symmetrical shape of the diagram.
Stereographic Projections ("Stereonet")
Depending on which one is selected in the Lambert programs preferences, two different types of projections can be shown:
- Wulff Net. This is a stereographic equiangular projection. It is well suited to display individual data. In addition to the poles of the planes also their great circles are displayed.
- Schmidt Net, an equal area net. This type of projection is used in structural geology to statistically evaluate a larger number of measurements. Also here, pole and great circles of the planes are plotted.
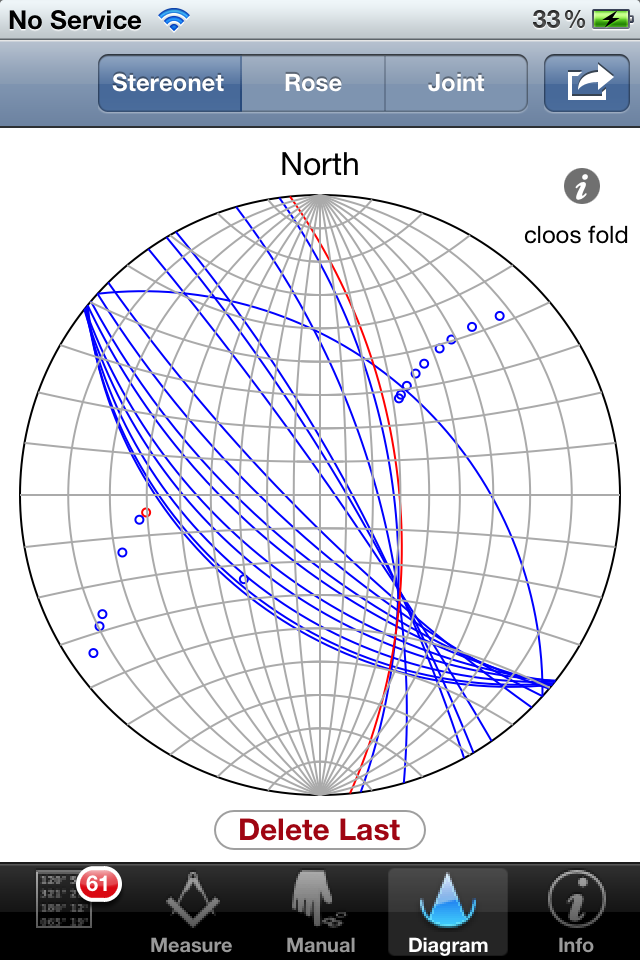
In both projections the last measured data is plotted in red, so that the user easily can distinguish the latest measurement from the previous. Linears are plotted as crosses and plane poles as small circles. You can delete the last measurement by tapping the "Delete Last MS"-Button (feature is OFF by default - enable in iPhone Settings-Lambert Settings). This functionality was included to enable fast removal of poor data immediately after visual check of the measurement in the projection view. However, this action cannot be undone! If you want to prevent yourself from accidentally tapping this button, you should deactivate it in the Lambert app settings in the iPhone settings.